How did SPRITZ come about?
It all started with a simple question: Is it possible to know, in real time, how much water a field uses and what environmental impact it has?
Spritz (Sensorized Platform for the Reconfiguration of Irrigation based on Zone measurements), a research and development project, aims to provide a system for monitoring and measuring water and energy footprints. This involves the design and implementation of a smart irrigation control unit capable of addressing emerging issues related to energy costs and the need to reduce water waste.
The General Architecture of the Control Unit
The Spritz system is structured as a distributed IoT ecosystem, consisting of measurement nodes, a control node, and a cloud platform.
Main Components
- Spritz Smart Control Unit, based on a Microcontroller ESP32
- LoRaWAN Gateway RAKwireless, equipped with an IoT SIM card for direct data transmission to the cloud
- LoRaWAN sensors: leaf wetness sensor, weather station, PAR sensor, 4 Seeed Studio S2105 sensors (one for each row), LoRaWAN water meter
- Dedicated power supply box for the gateway and Spritz control unit
System Workflow
Sensors installed in the rows collect environmental and agronomic parameters; this data is transmitted via the LoRaWAN network to the gateway. The gateway forwards the data to the Lifely cloud, where the data is normalized and aggregated.
The Spritz control unit uses this information to execute the decision-making algorithm and, based on the outcome, independently controls the irrigation solenoid valves.
The system has been implemented and validated across four rows, each managed as an autonomous logical unit.
Modular approach
The control unit is designed using a modular approach and consists of: a main MCU board, I/O submodules for interfacing with actuators, and functional separation between the power supply, control logic, and input/output interfaces for expansion modules (sensors/actuators).
This modularity is not limited to the control unit’s hardware but extends to the entire Spritz system. The LoRaWAN sensors are completely decoupled from the control unit, and each row is managed as an independent entity; therefore, adding new rows or sensors does not require any hardware modifications.
This approach ensures replicability and scalability, key requirements for real-world agricultural applications.
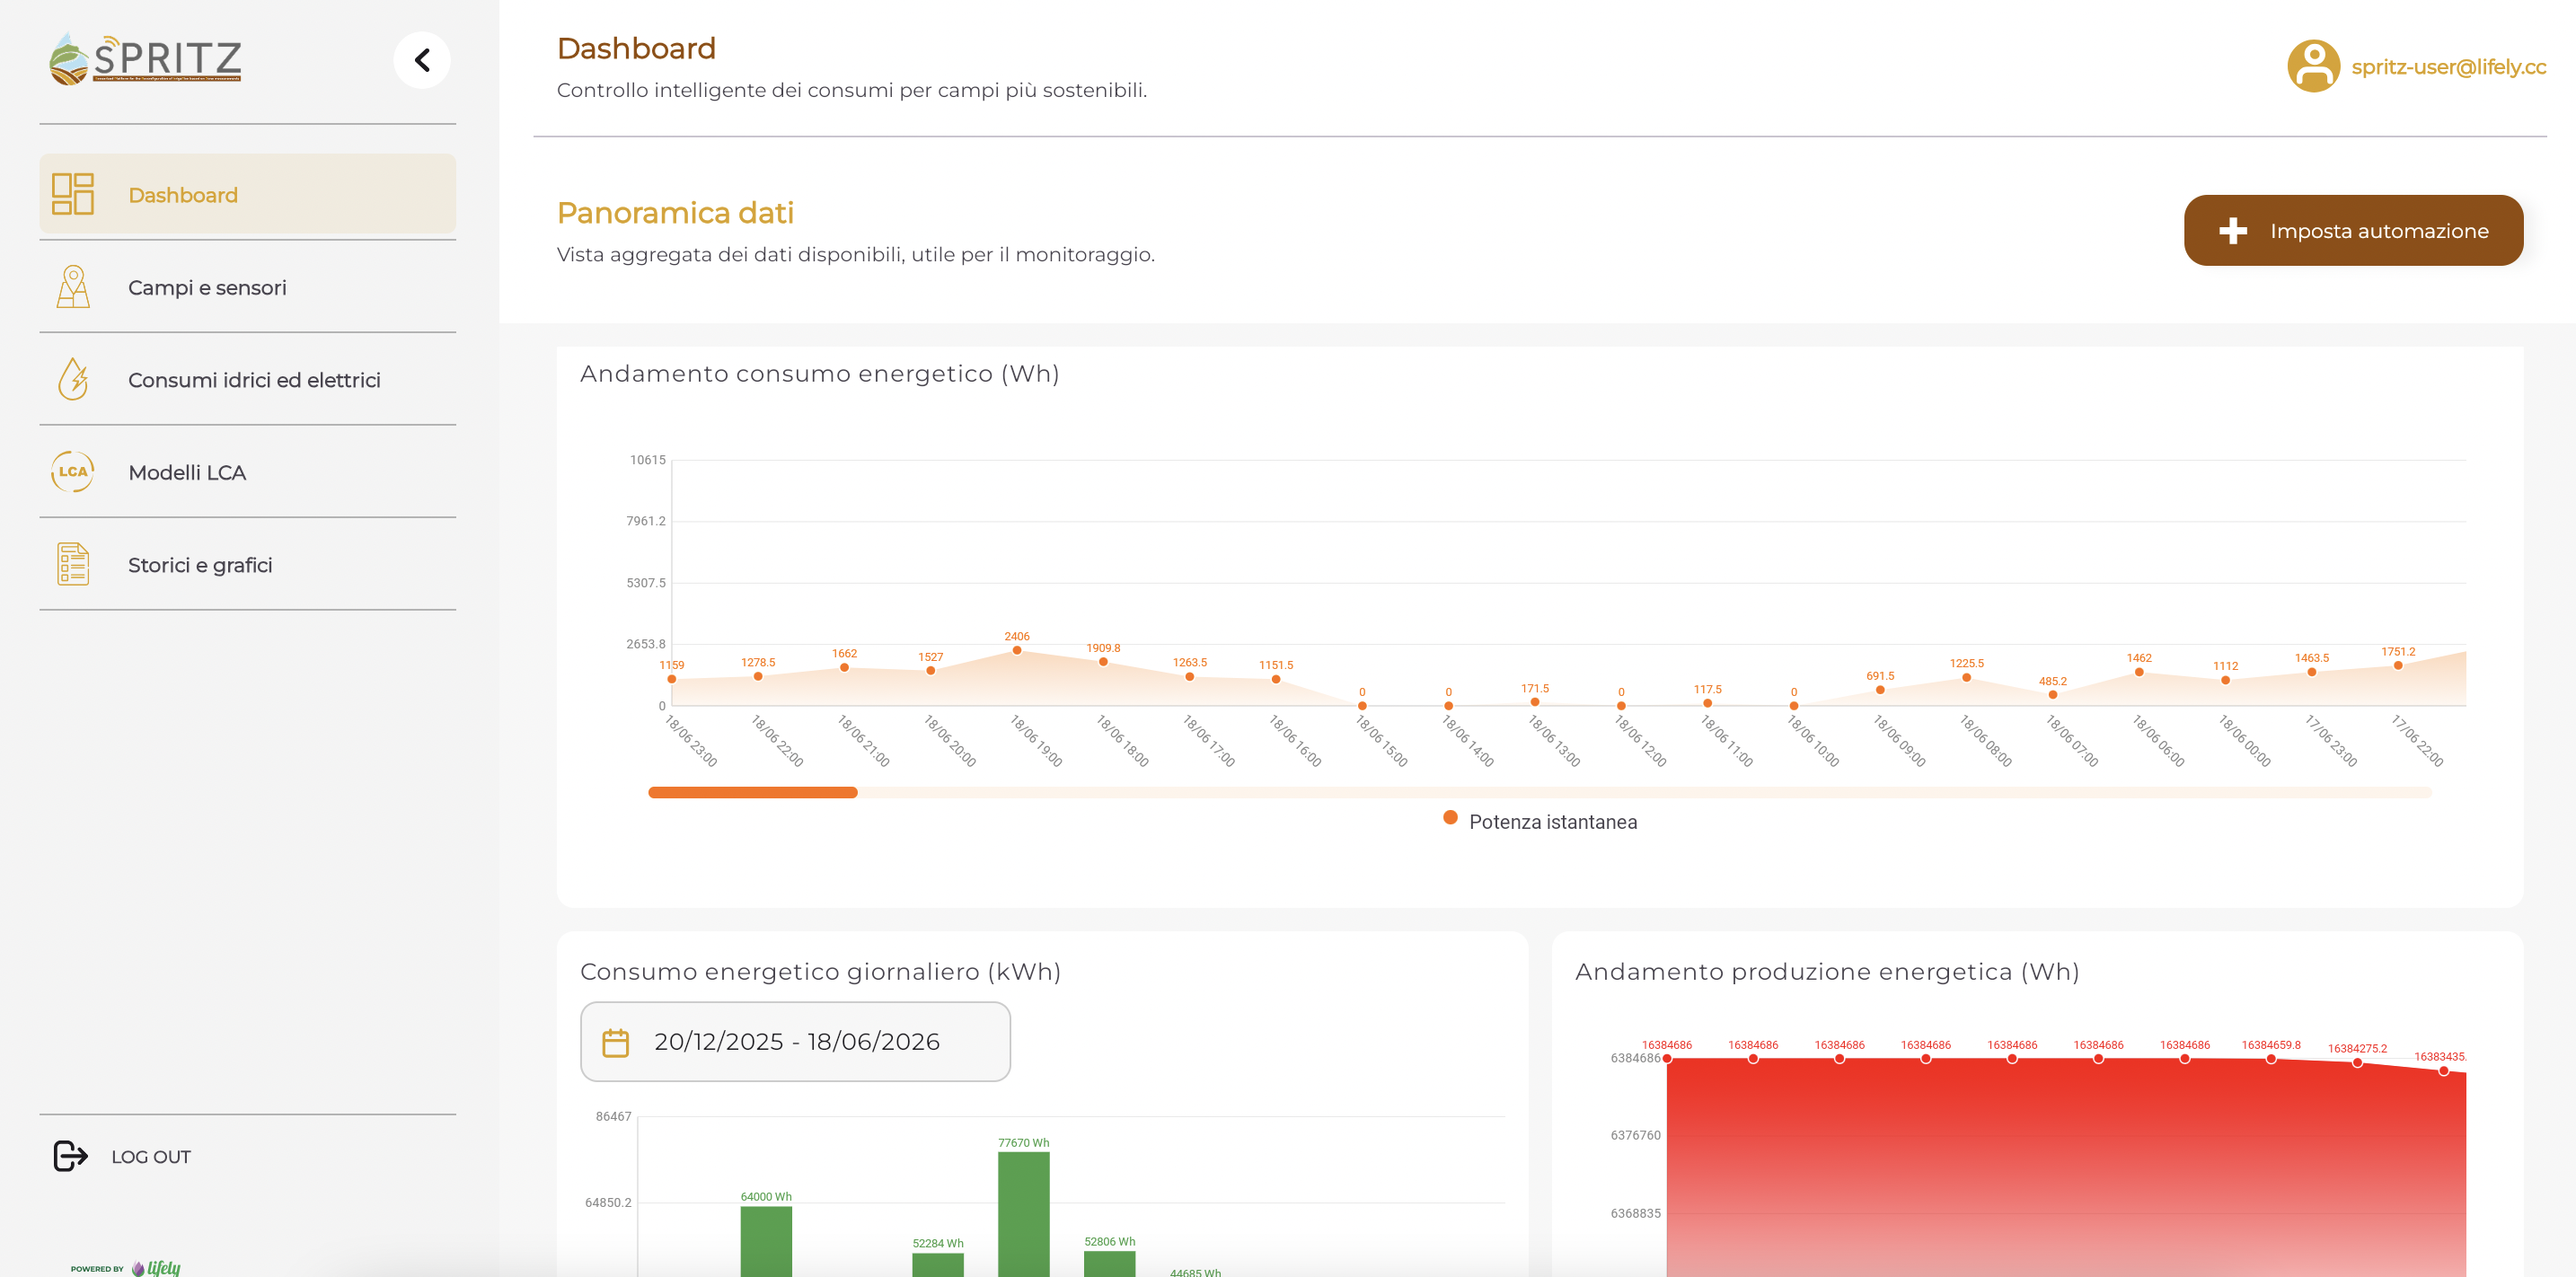
Energy Consumption Measurement System
Energy data is processed using the AWS EC2 infrastructure, which performs the following functions:
- normalization and archiving of consumption data
- acquisition of energy production data from the photovoltaic system (if present)
- distinction between energy drawn, produced, and self-consumed
- monitoring of the total electrical load
The EC2 system is configured to:
- compare instantaneous consumption with the meter’s maximum capacity
- generate automatic alerts when consumption approaches the 15 kW threshold
- prevent service disconnections and overloads.
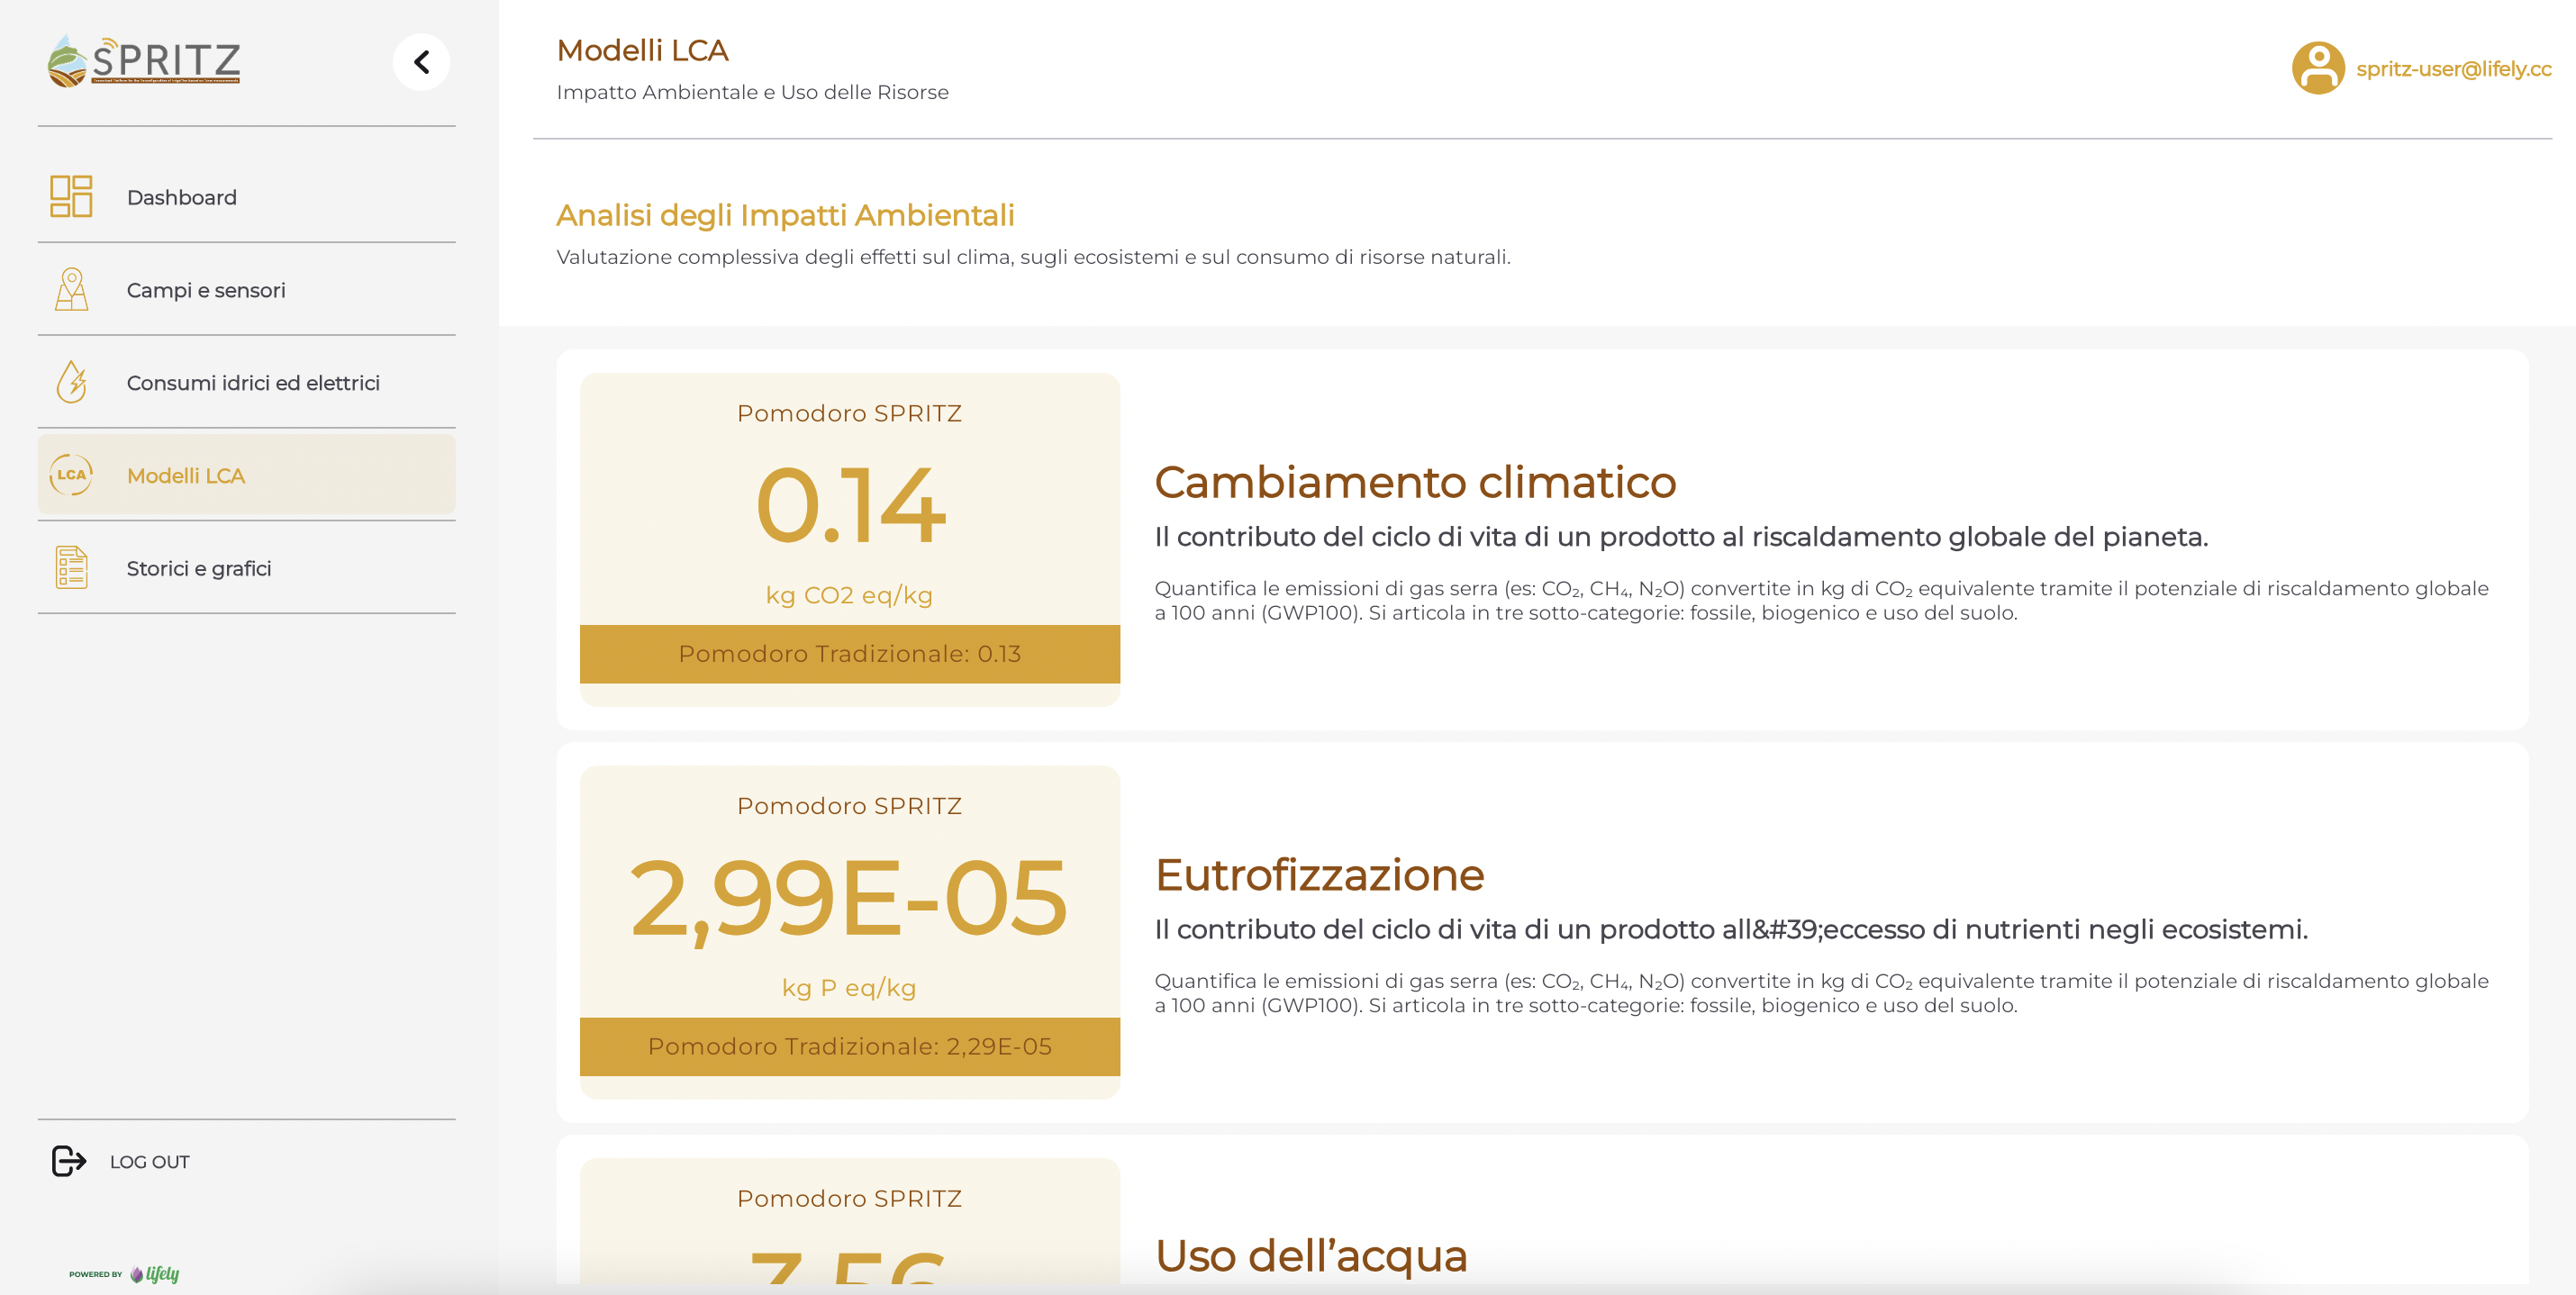
The Added Value of SPRITZ: The LCA Module
One feature that sets this project apart is undoubtedly the integration of the Life Cycle Assessment (LCA), carried out in collaboration with the CNR in Sassari.
By integrating energy consumption with water and agronomic data from the sensors, it is possible to calculate four LCA indicators for each production cycle:
- Climate change
Quantifies greenhouse gas emissions (e.g., CO₂, CH₄, N₂O) converted to kg of CO₂ equivalent using the 100-year global warming potential (GWP100). It is divided into three subcategories: fossil, biogenic, and land use - Eutrofizzazione
Excess nitrogen (N) and phosphorus (P) in aquatic and terrestrial ecosystems, caused by fertilizers, livestock manure, and municipal wastewater. There are three subcategories: freshwater (kg P eq), marine (kg N eq), and terrestrial (mol N eq) - Water use
Quantifies freshwater consumption weighted by local availability, giving greater weight to withdrawals in the most arid regions. It is expressed in m³ of water deprived (m³ world eq) - Fossil Resource Use
Quantifies the energy extracted from fossil resources (oil, natural gas, coal) in relation to their remaining geological reserves. It is expressed in MJ, based on the energy content of the consumed resource
The reference case is tomato cultivation at the AGAVE Agritourism, compared to traditional production.
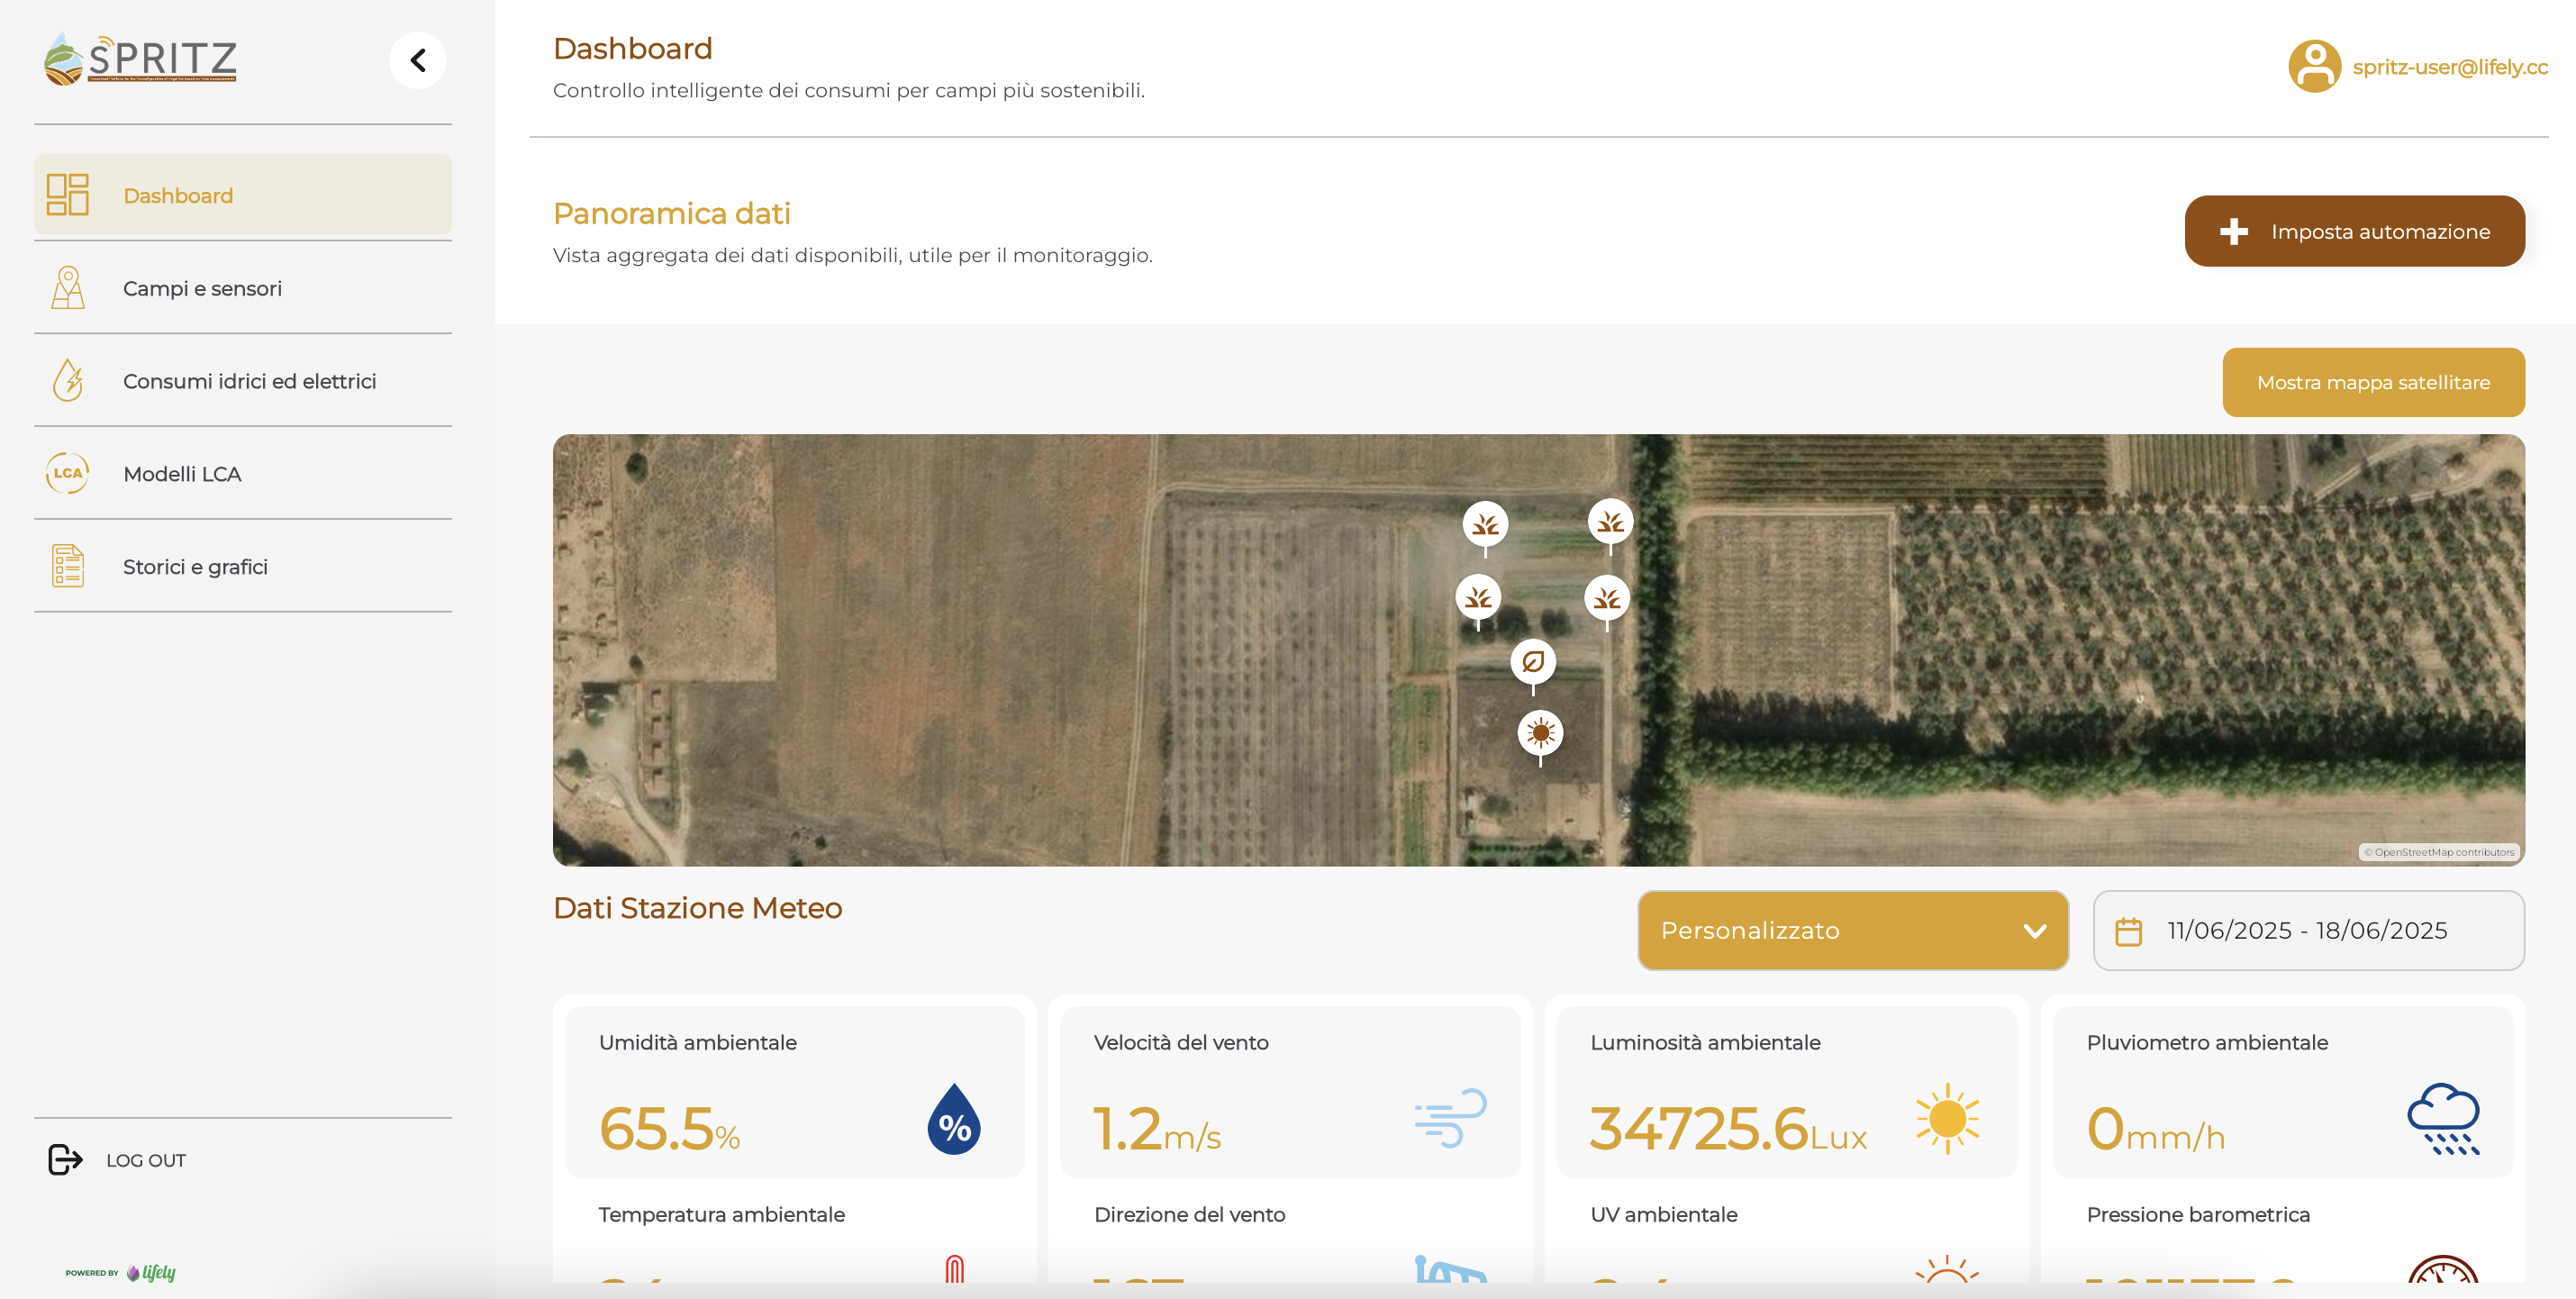
The Dashboard
Of course, one of the project’s objectives was also to make the data readable and easy for farmers to interpret.
The dashboard serves precisely this purpose: to ensure that all the most relevant data is presented in a single location.
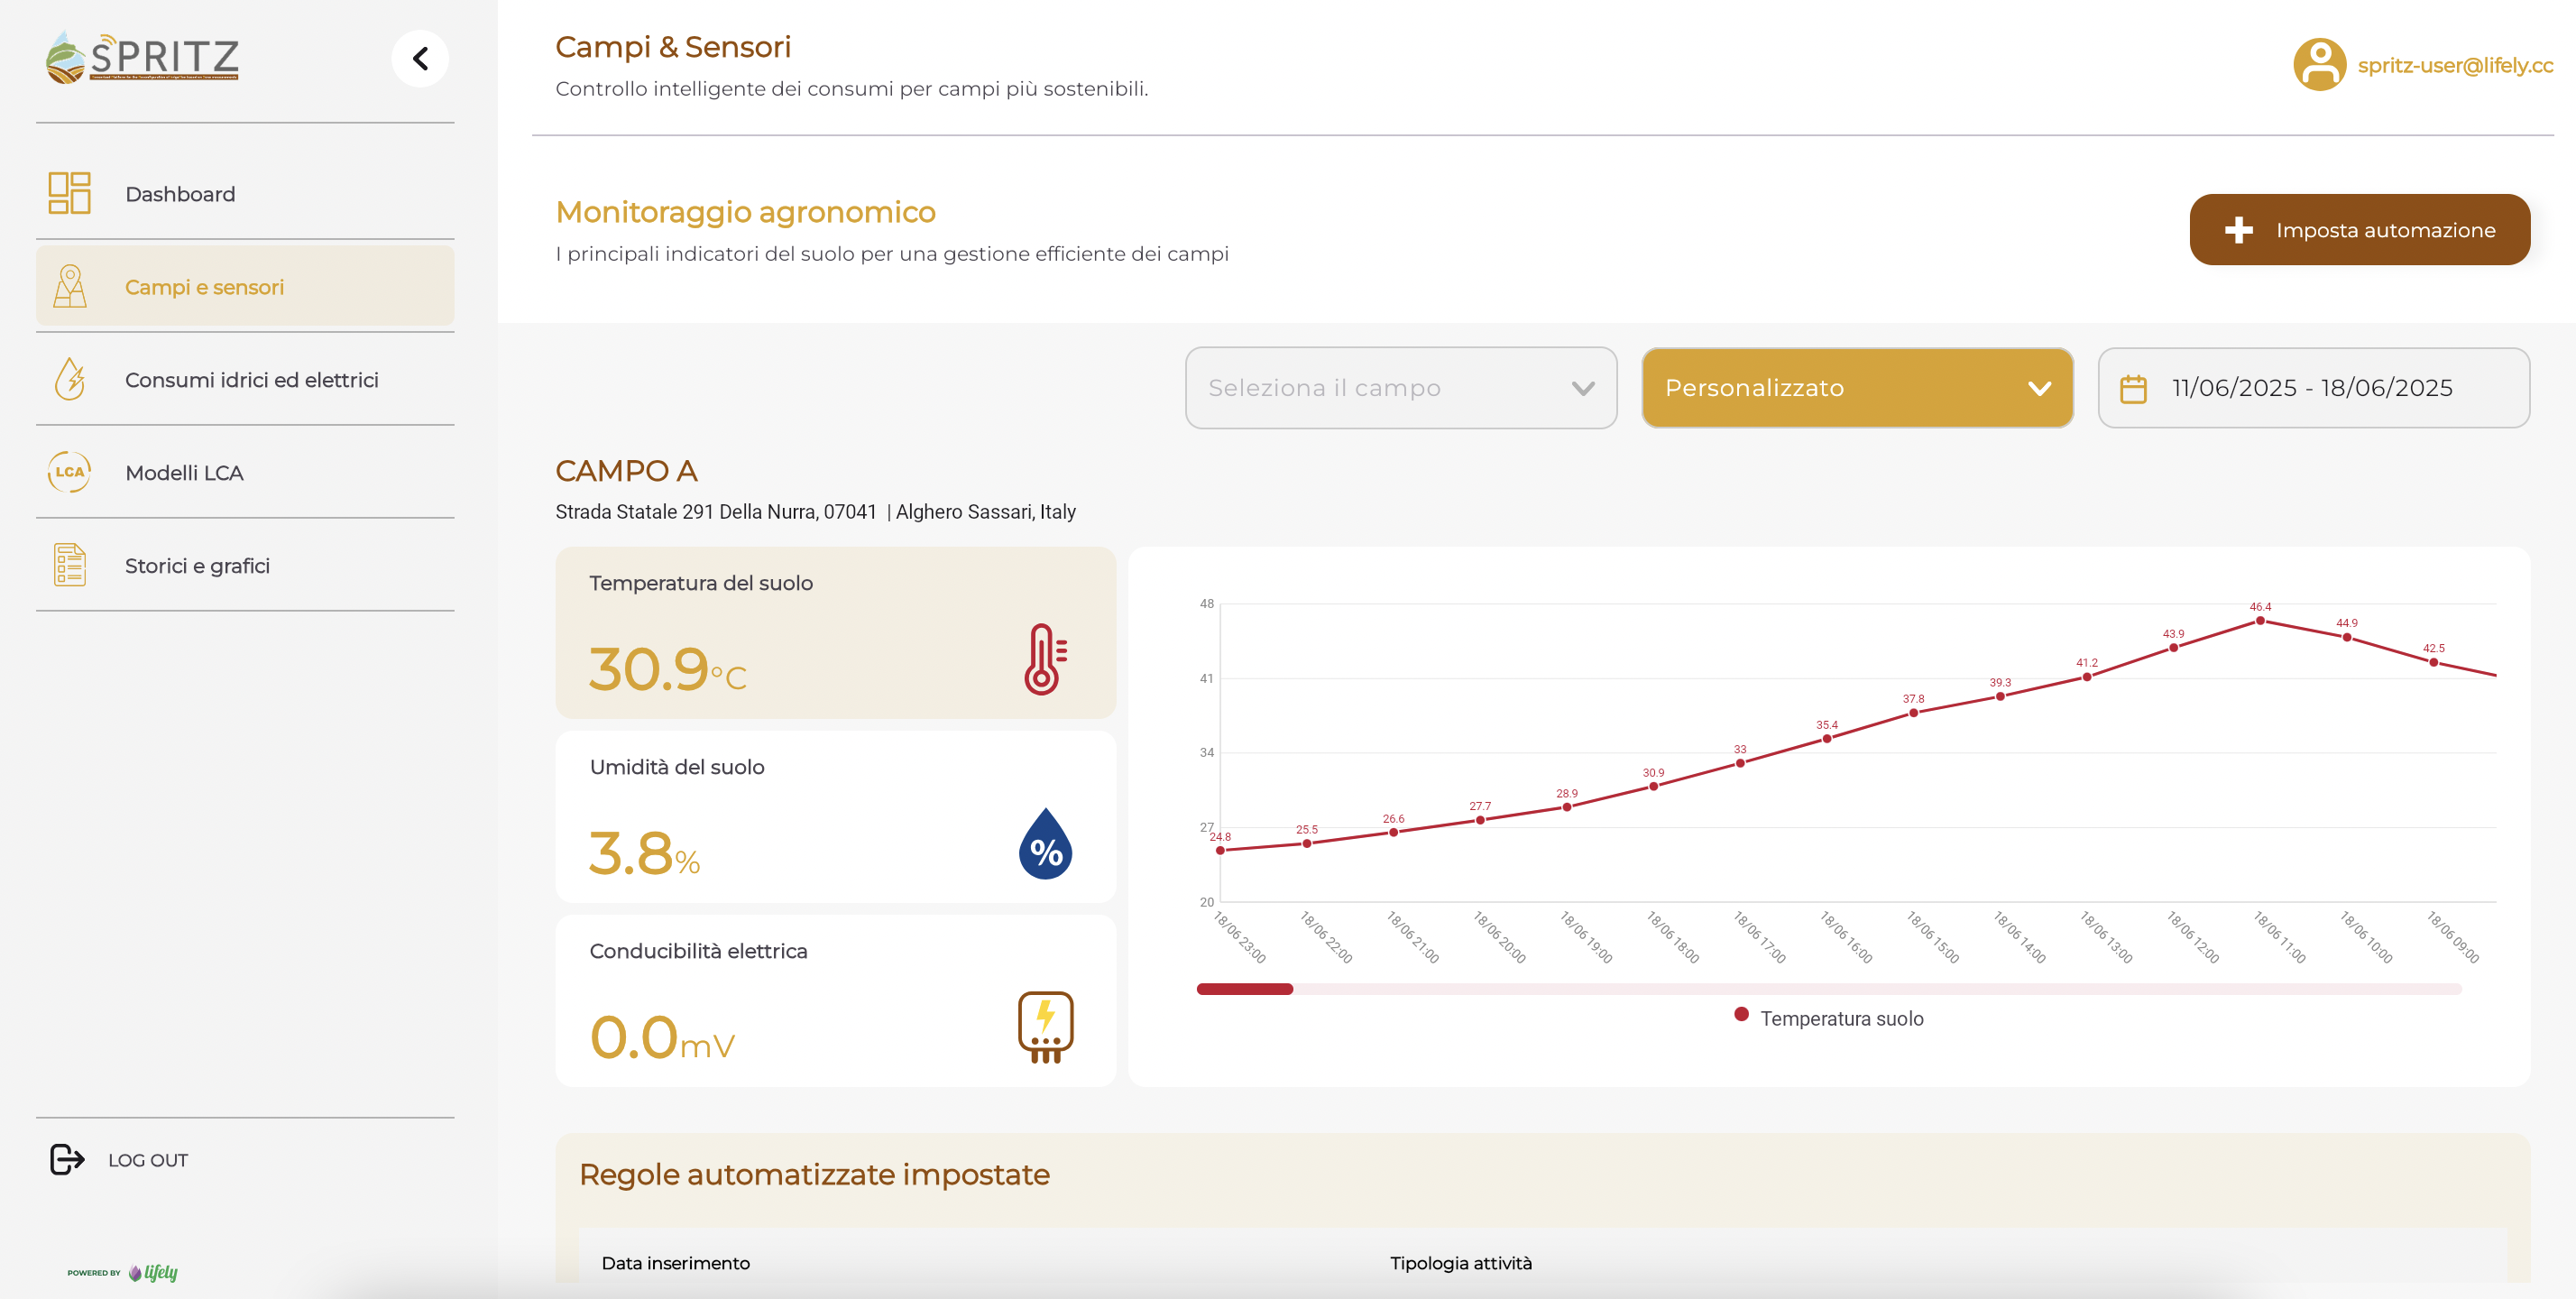
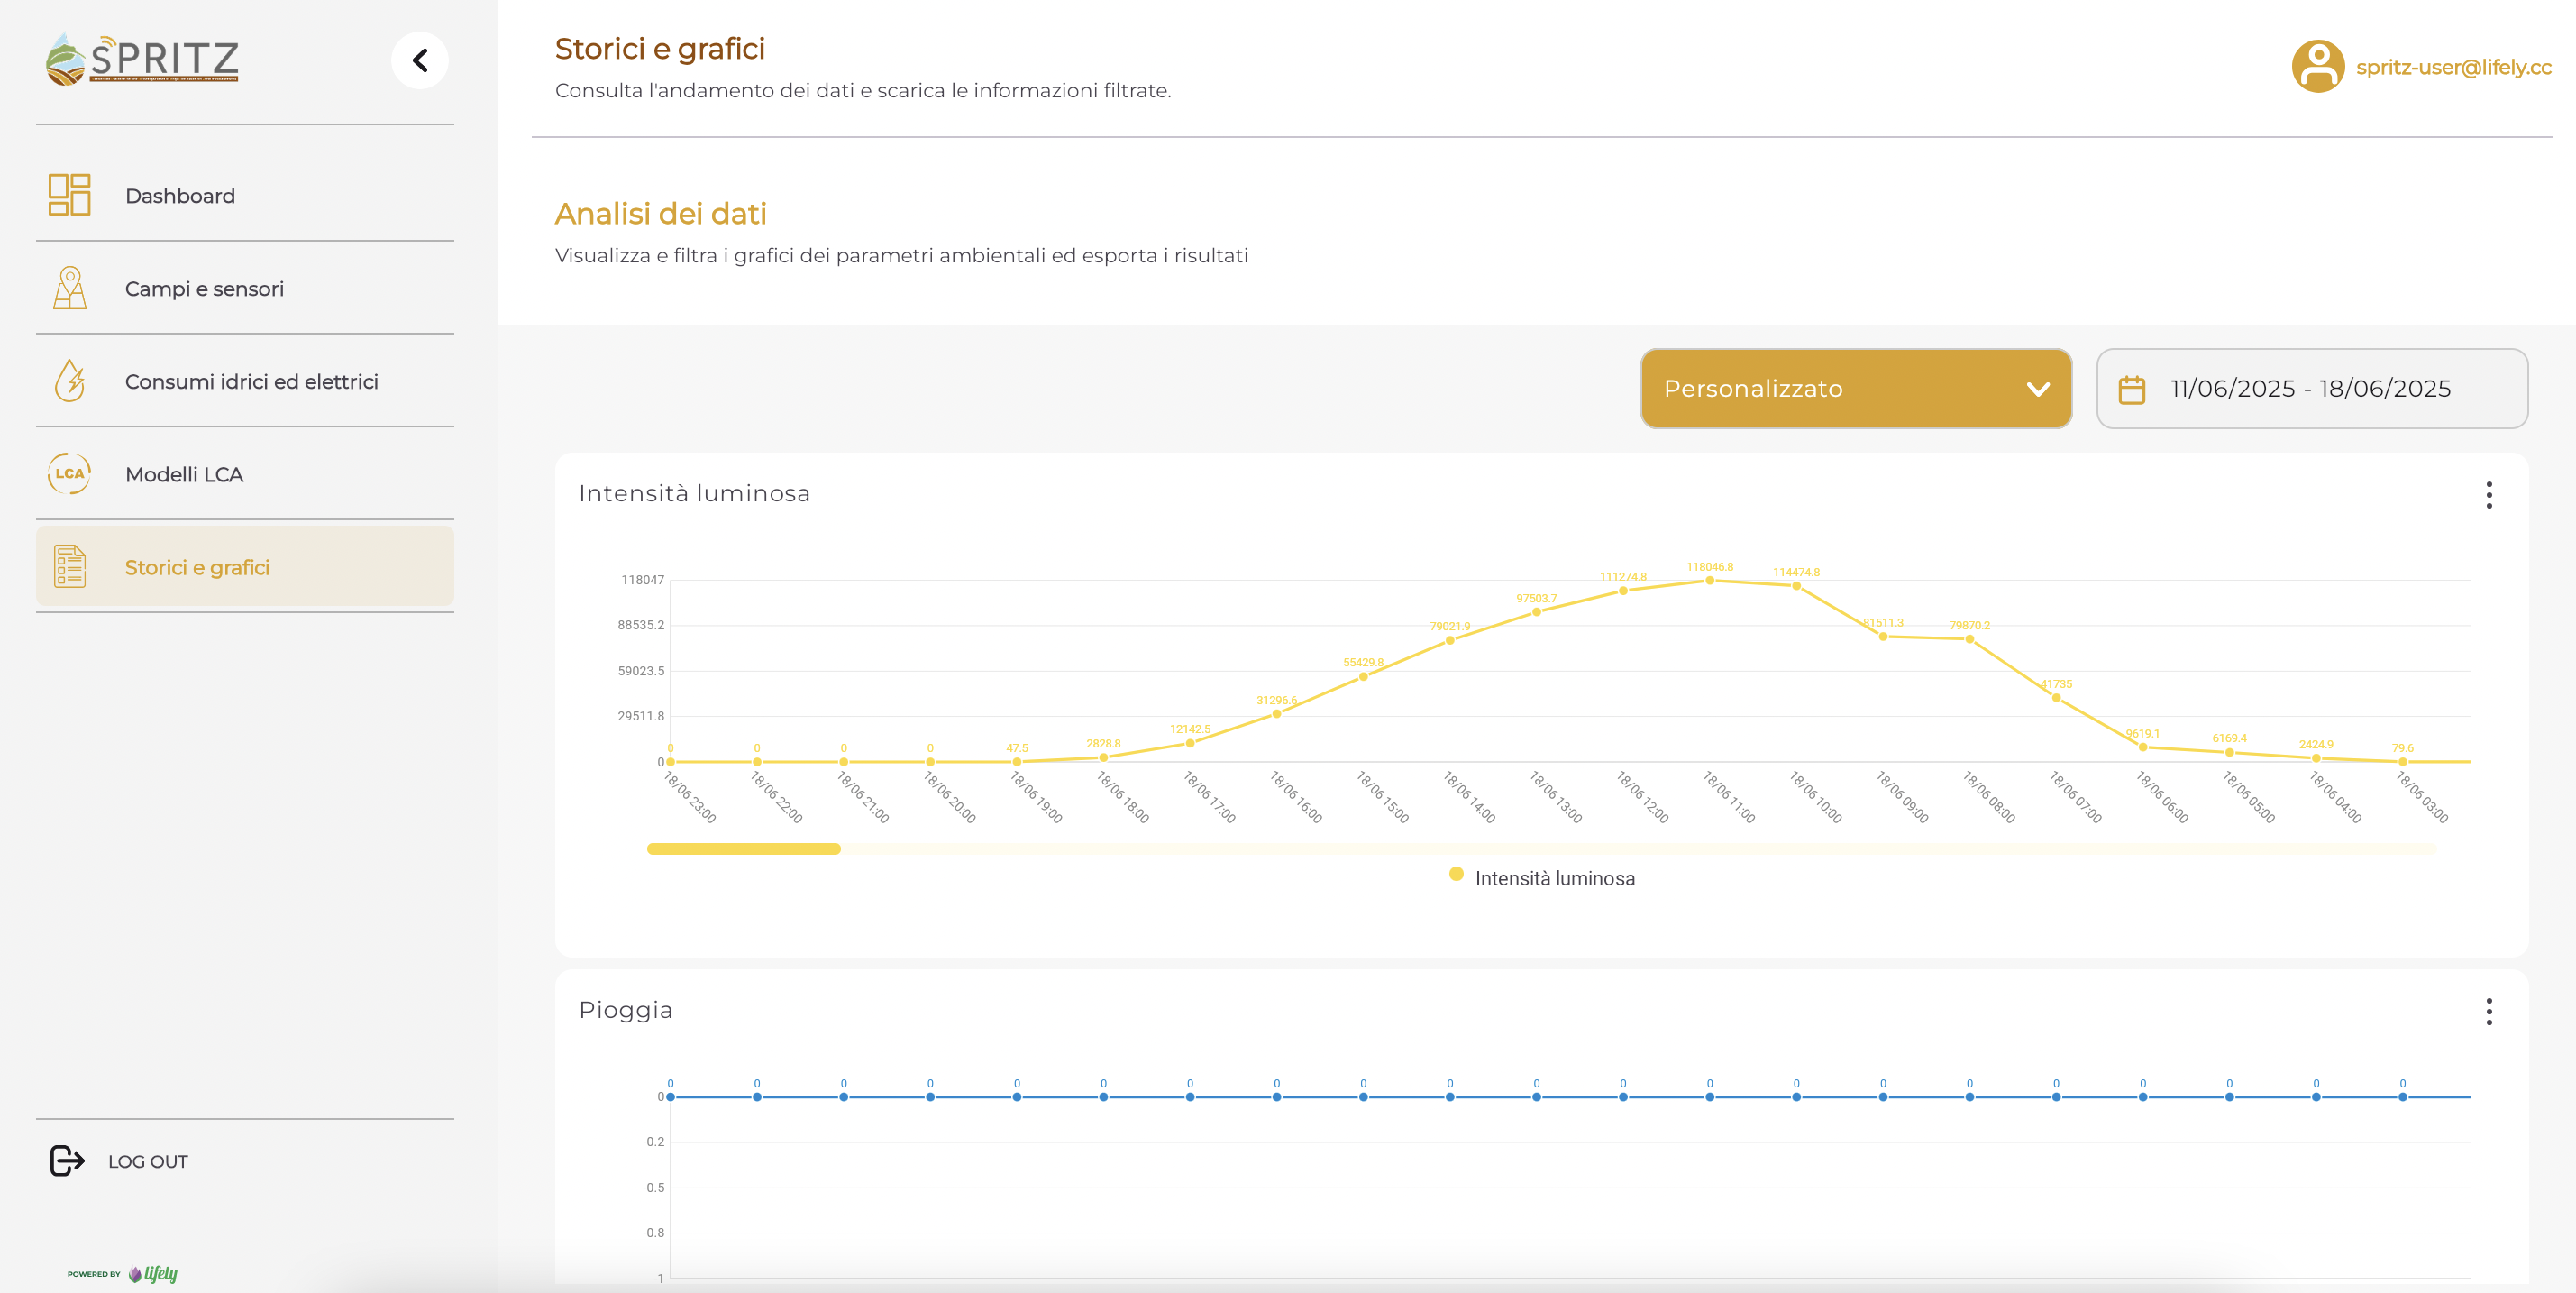
Currently, the platform is organized into five pages, each dedicated to a specific aspect: dashboard, fields and sensors, water and electricity consumption, LCA models, and historical data and exportable graphs.
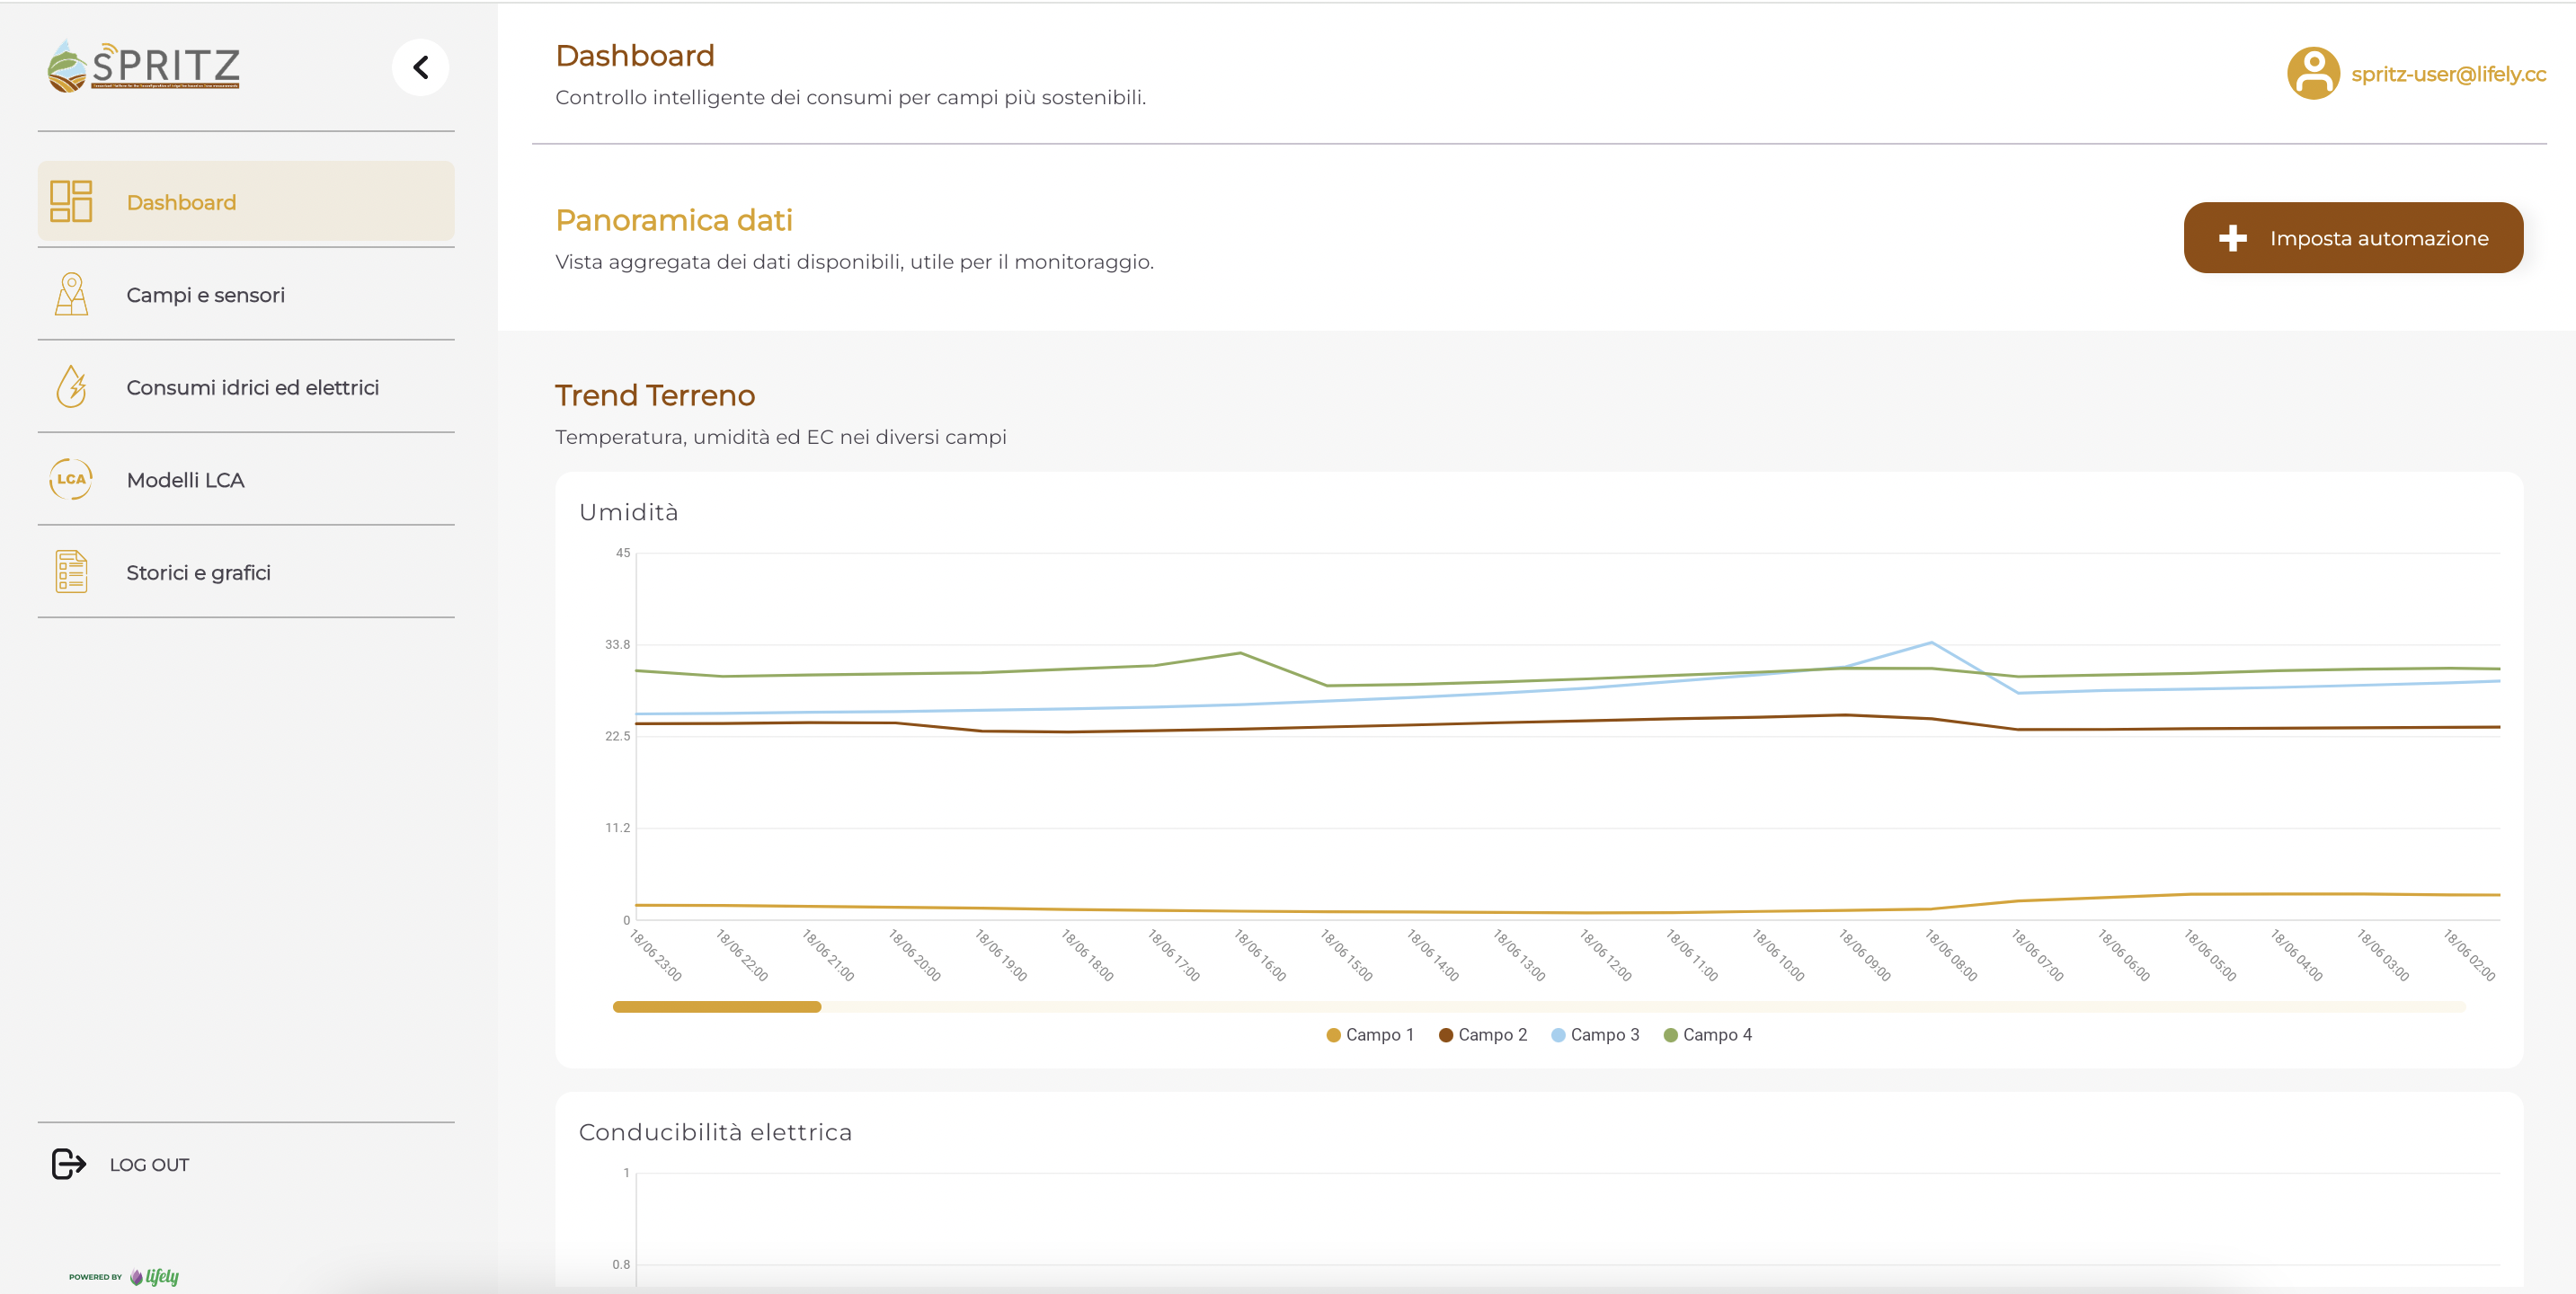
The dashboard is the main page, which contains a summary of the most relevant information and data, such as readings from the various sensors, trends in moisture, temperature, and electrical conductivity for each plot of land, as well as data on water and electricity consumption.
Discover SPRITZ ( Sensorized Platform for the Reconfiguration of IrrigaTion based on Zone measurements).